


|
|
|
|
|
|
| |
| James E. Schueler | |
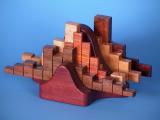
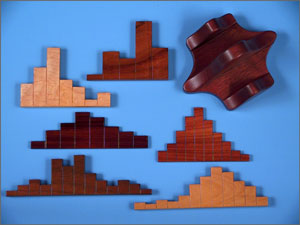 | Description: | A purple curvilinear base comprised of a horizontal bottom and three vertical pieces screwed to the bottom, and six separate pieces each having a different color and specific shape (but each appearing to consist of several rectangles). |
| Woods: | Base of "Bell Curve" Shapes - Amaranth (Purpleheart) Six "Rectangular Pieces" - Padauk (Vermillion), Koa, Bird's Eye Maple, Walnut, Satinwood, Honduran Rosewood. | |
| Finishes: | Base of "Bell Curve" Shapes - "Flecto" Varathane Liquid Plastic, 91 Clear Satin. Six "Rectangular Pieces" - "Minwax" (fast-drying) Polyurethane, Clear Gloss. | |
| Size: | Approximately 4" H x 8" W x 5" D. |
Notes: | Base of "Bell Curve" Shapes. The base represents the entire population (all possible values or results of any physical property or phenomenon). An example would be the varying diameters of all bolts manufactured during a specific set of circumstances (system parameters, such as type of metal, machine settings, etc.). Although it would be nice to have a record of the entire population (all diameters of the bolts produced) to verify conformance with specifications, it is usually impractical to obtain so many pieces of data (measure every bolt). Therefore, it is customary to take a small sample of the population (measure the diameters of several, say 30, bolts from the 60,000 produced), consider them to be "representative" of the population, and make decisions based on the characteristics of the limited sample. It should be noted that the base of this sculpture is broad, stable, and dependable - as would be predictions or inferences based on the usually unavailable characteristics of the entire population. The satin finish of the base indicates its lack of glamour, corresponding to the lack of attention ordinarily given to focusing on the probable shape of the underlying population. Six "Rectangular Pieces". Each of the six separate pieces represents a sample that might be taken from the same "underlying" population. The rectangular shape of each piece is based on that of "sample histograms" commonly used to represent graphically what portion of the sample (height of each rectangle) had values within certain ranges (width of each rectangle). Each sample is different because of the random nature of the sampling process - the color of each "sample" is therefore different. Even for relatively small samples, the means (averages) usually are fairly reliable - the centers of gravity of the six pieces therefore line up fairly well when placed on the base. For the same sample size, the degree of variability within each sample (dispersion) is less reliable from sample to sample than the mean - the overall widths of the six pieces are therefore quite different. For the same sample size, the skewness (lack of symmetry) of the histogram is even less reliable than the dispersion and far less reliable than the mean. The six pieces of this sculpture vary widely in their lack of symmetry to reflect this general characteristic of sample skewness. In fact, some samples taken from the same symmetric population will be skewed left and some will be skewed right. Therefore, the skewness of each of the six sculpture histograms can be reversed (from skewed left to skewed right) by removing it from the base and replacing it in the reversed position. The same effect can be achieved by viewing the sculpture straight on and then in a mirror. It should be noted that the bottom of each of the six pieces is rounded, making each sample histogram unstable and unable to stand on its own - just as predictions or inferences based on the skewness of a sample are unreliable. The glossy finish of the six pieces gives them a glitter and shine that draws attention to them - "reflecting" the allure that causes so many intelligent people to assume in making predictions or inferences that the population has the same skewness as their one (usually small) sample. One example of the misguided reliance on sample skewness in making predictions is the estimation of maximum stream flows by the hydrologic community. Many other examples of attempting to assign the skewness of a sample to the population from which it was taken can be found. It must also be mentioned that the center vertical piece of the base (population) and the six histograms (samples) have been normalized so as not to be misleading. Normalization was achieved by making all seven surface areas as nearly equal as possible. |
photographs copyright © Stephanie Schueler
| comment | |