


|
|
|
|
|
|
| |
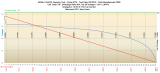
This discharge curve may be helpful to some. The data is the same data in the video above only in a graphical format. Of interesting note is how little capacity is physically stored above 3.32VPC or 13.26V as a 12V nominal pack..
In the graph the 400Ah rated battery has only delivered 2.83Ah's by the time the voltage curve levels out at 3.32VPC under a 30A load. When these cells are at 100% SOC they can have a resting voltage of about 3.38VPC to 3.40VPC or 13.52V to 13.60V, for a 12V nominal pack, but there is really very little stored energy between 3.4VPC and 3.32VPC about 0.65% of Ah capacity to be exact.
On this pack the stored energy between 3.4VPC and 3.32VPC was 2.83Ah's. This is the rather abrupt near vertical portion of the blue voltage line at the very beginning of the curve. Also, at low rate discharges, such as this .075C discharge rate, the curve is more gradual and it is not until about 2.9VPC that the voltage starts to hit the knee and drop rapidly, in a near vertical fashion.
On a 400Ah rated pack, at a 30A / .075C discharge rate, the working voltage range between about 99.3% SOC and 0% SOC is only a 1.66V difference for this 12V nominal pack.
I have included the loaded voltage points as well as every 10% of capacity in delivered energy. You may need to click on "original", below the image, to see the data better.
© All Images property of Compass Marine Inc.