Focus Test Charts
| previous page | pages 1 2 ALL | next page |
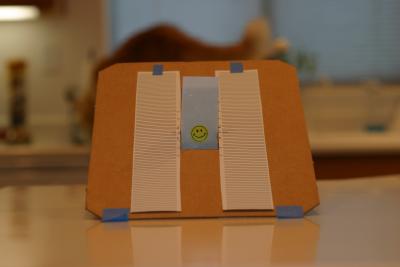
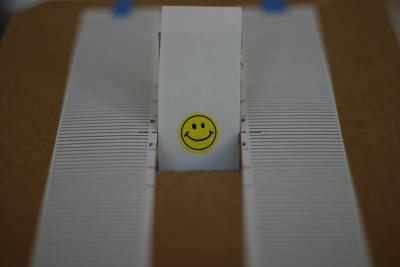
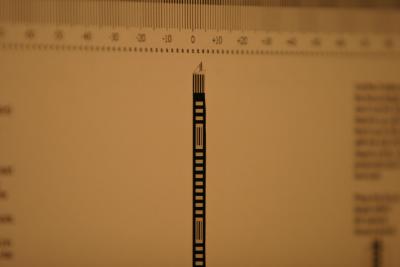
IMG_1273.JPGTest Chart - Front View |
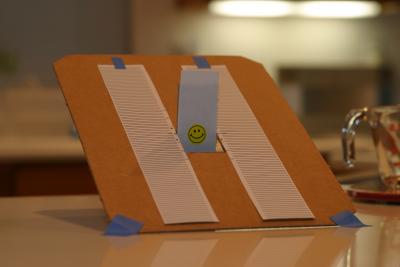
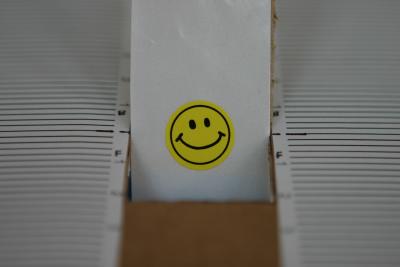
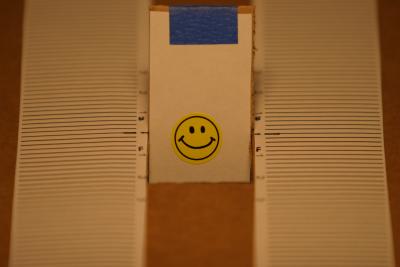
IMG_1267.JPGTest Chart - Angle View |
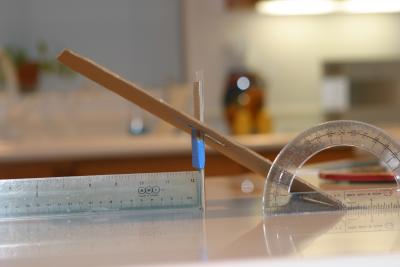
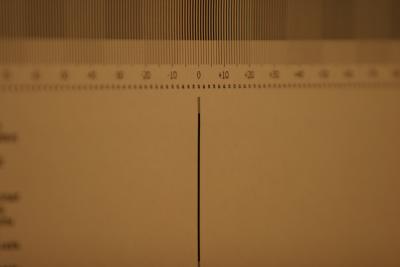
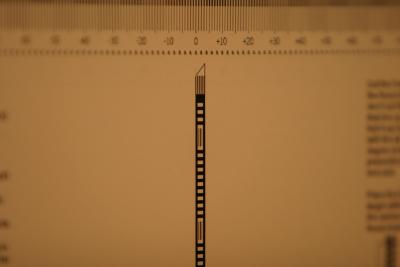
IMG_1270.JPGTest Chart - Side View |
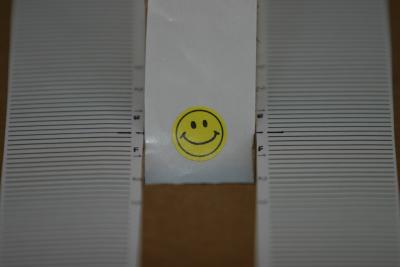
IMG_1259.JPG70-200/2.8L @ 200mm/f2.8 |
IMG_1261.JPG50/1.4 @ 50mm/f1.4 |
IMG_1279.JPG24-70L @ 70mm/f2.8 |
IMG_1332.JPG70-200@200mm f/2.8
Poon's original test chart
Slight backfocus |
IMG_1333.JPG70-200@200mm f/2.8
Poon's improved chart before cutting
Still slight BF |
IMG_1336.JPG70-200@200mm f/2.8
Poon's improved chart with cutout target line
Perfect results |
IMG_1334.JPG70-200@200mm f/2.8
My test chart re-tested today
Near perfect results |
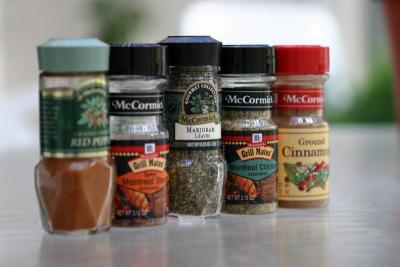
IMG_3193.JPG24-70L @ 70mm/2.8
Distance to target about 3 feet. Focus point on middle jar.
Note that there is more DOF to the rear which is to be expected. |
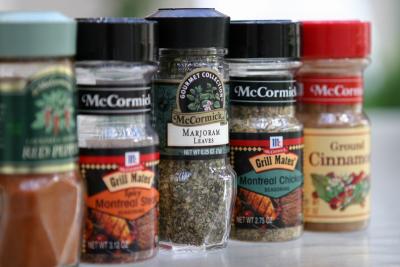
IMG_3194.JPG24-70L @ 70mm/2.8
Distance to target about 2.5 feet; focus point on center jar.
The DOF decreases as the target gets closer but there is still more DOF to the rear. |

IMG_3195.JPG24-70L at 70mm/2.8
Distance to target about 2 feet; focus point on center jar.
DOF has decreased further so that center jar is the only one in focus. |

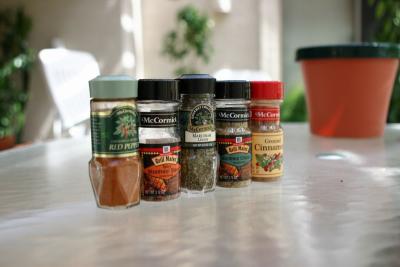
IMG_3196.JPG24-70L at 51mm/2.8
Distance to target about 2 feet; focus point on center jar.
Same result as at 70mm, center jar is in focus with more DOF to rear. |
IMG_3197.JPG24-70L at 24mm/2.8
Distance to target about 2 feet; focus point on center jar.
Similar result; center jar is at best focus but DOF appears balanced. |
| previous page | pages 1 2 ALL | next page |
click on thumbnails for full image


