photo sharing and upload picture albums photo forums search pictures popular photos photography help login
Rolf Olsen | profile | all galleries >> Astrophotography >> Colour-Magnitude Diagrams tree view | thumbnails | slideshow

Colour-Magnitude Diagrams


I have created a couple of colour-magnitude diagrams for some of the globular clusters I have imaged. I was surprised with how successful it turned out and how simple the process was, so I'll briefly describe what I did here:

To create these diagrams I downloaded the demo version of AstroArt. The demo lets you export a list of stars from an image, so that is perfect for this purpose.
I used the stacked B and L raw FITS images to generate the data. First I loaded the B image into Astro Art. Then from the Tools menu I selected 'Find Stars' and entered desired number of stars and FWHM criteria. For Omega Centauri I chose for example 30,000 stars. For the other clusters I chose a smaller number since they are more compact and crowded and there aren't as many stars available for selection.
Then I went to View -> Stars and a table with all the selected stars is displayed. I sorted the rows according to X coordinate and saved the star data as a .sta file via right-click menu.
I then repeated the proces for the L file, using the same star selection criteria.
(The .sta format is simply tab/space separated values and can be opened in any text editor)

The main challenge was to somehow match each star in the two B/L .sta files and create one new file with correct magnitudes for the matched stars. Not all stars will be matched since AstroArt will not necessarily select the same stars in each image. So for this purpose I wrote a small Gosu program that scans the two files and matches the entries by their coordinates. The program also calculates the magnitudes based on the ADU count. The result is a third file with the magnitudes for each star that was matched in the B and L file. This way I ended up with around 10,000 matched stars with magnitudes out of the 30,000 stars I selected for Omega Centauri.

Now I could open this new file in Excel and create a scatter plot for the data, and voila a textbook perfect colour-magnitude diagram emerged, complete with red giant branch and horizontal branch. Encouraged by this I repeated the process for some other globular clusters with equally effective results, allthough with fewer stars.

To ensure reasonably accurate B-V values for the globulars it is necessary to take the extinction, or interstellar reddening, into account. This is the difference between an objects observed color and the theoretical color which it would have if unaffected by extinction. The color excess E(B-V) is related to the B-V colour by:

E(B-V) = (B-V)observed - (B-V)intrinsic

The program allows for the extinction to be entered by the user and the intrinsic B-V values are then written in the output file. I used 'Catalog of Parameters for Milky Way Clobular Clusters' (W.E.Harris 2012) to look up the extinction E(B-V) for the globulars.

Below are the resulting colour-magnitude diagrams for the globulars NGC 6752, Messier 4, Omega Centauri, Messier 80 and NGC5286.
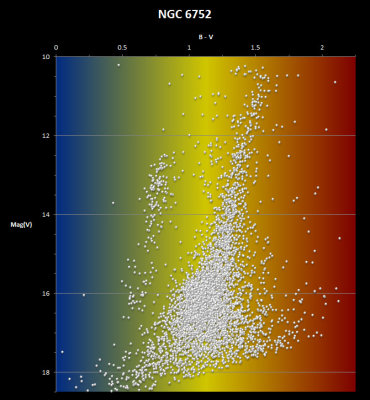
Colour-Magnitude diagram for NGC6752
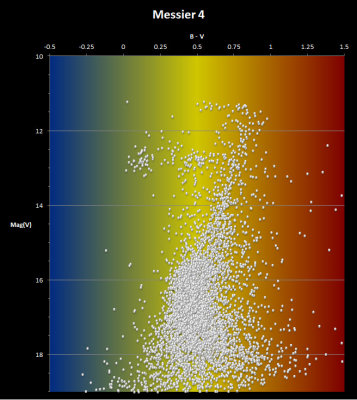
Colour-Magnitude diagram for Messier 4
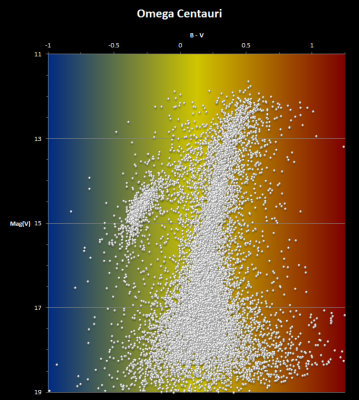
Colour-Magnitude diagram for Omega Centauri
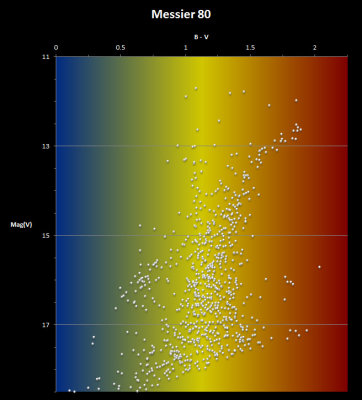
Colour-Magnitude diagram for Messier 80
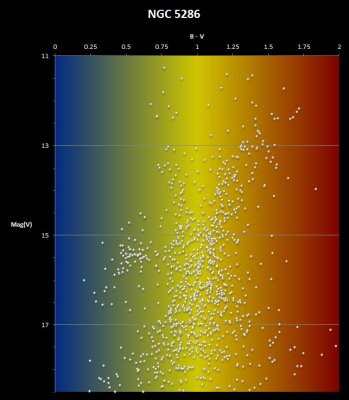
Colour-Magnitude diagram for NGC5286