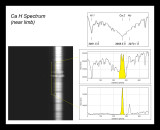
The top plot is a "quiet disk" reference spectrum near Ca H (line centre at 3968.5 A). The middle and lower plots were taken from the indicated locations on the measured spectrum, looking near the E solar limb. You can see the "doubly reversed" Ca H absorption on the disk (middle plot - yellow peaks plus dip) which makes the transition to the pure emission spectrum in the prominence (bottom spectrum - yellow peak). Notice the H epsilon feature visible as well.
There seems to be a lot of science in the exact nature of the transition from Ca H absorption on the disk to Ca H emission "off limb". In the recent paper "Spectroscopy at the Solar Limb" by C. A. R. Beck and R. Rezaei (Astronomy & Astrophysics, v531, pg.A173 (2011)), the authors claim: "The average off-limb spectra of Ca II H present a good opportunity to test static chromospheric atmosphere models because they lack the photospheric contribution that is present in disk-center spectra."