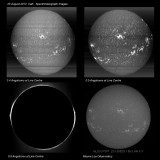
I've analyzed the August 25th images a bit more and produced better versions. Instead of uploading them individually, I put them together in an animation.
This "Spectral Animation" is a sequence of 10 frames taken at different spectral locations within the CaK absorption band. The 1st frame is taken at approx 0.28 angstroms blue of line centre (3933.71). For each successive frame, a step in wavelength of approx 0.14 angstroms is introduced. You can see the dramatic increase in contrast near line centre.