


|
|
|
|
|
|
| lwestfall | profile | all galleries >> Galleries >> Lens Tests | tree view | thumbnails | slideshow |
The only real caveat when making these comparisons is the reality of sample variation. Hopefully the tests are representative of at least the middle (or upper) 50th percentile of the respective lenses. The world may never know. But I tend to think Klaus's results are right on track -- the general consensus of photo community reviews do seem to me to support these data as indicative of a typical "good" copy of each of these lenses.
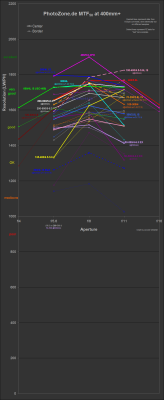
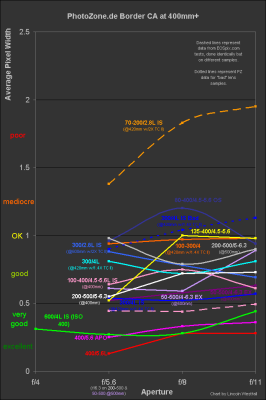
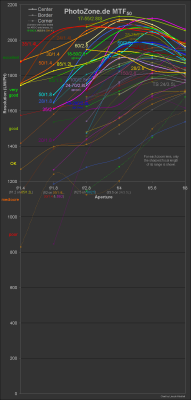
Some of these graphs include data from John Nevill's meticulous Lens Tests at his very cool site EOS-Images.com - these data are shown by DASHED lines. Like Klaus, John performed all his tests under identically standardized conditions, so comparing within John's data set should be completely legit as well. Interestingly the PZ & EOSpix curves seem to match up pretty well most of the time, but other times apparently reveal the great extent of lens sample variation.
HOWEVER, absolute comparisons BETWEEN these two data sets of course involves some fudge room for the differences in testing/analysis conditions and human error. A different RAW convertor was used, but John says the settings he uses bias the results to be in line with the sharpness output of Klaus's PZ tests. Other factors skewing these two data sets differently may include different lighting, slight sensor differences between the 20D and 350D, and slight differences in testing chart design and the regions of interest (ROIs) chosen from each test image for Imatest analysis for Center, Border, and Extreme Border MTF50 and Border CA. So when you compare between these data sets, try to think in relative (e.g. trends) rather than absolute terms. And don't forget the salt! :)
PLEASE NOTE that none of these graphs is to be used or distributed for any commercial purpose. Klaus and John naturally want to protect their ownership and the accuracy of their hard-earned test data and prevent them from being distributed without credit given to the sources. So they have given me permission to freely share these graphs but not the tabulated raw data files. But if you have specific advice on improving/correcting the data presentation, please let me know via email at lincolnwestfall AT gmail DOT com.
BTW, if you want to exclude certain lenses from any chart to yield a cleaner, personalized version for your own use, just open the chart image in Photoshop, select those specific curve colors, and replace them with the background gray! (Thanks to DPR user Gordon S Walker for the idea for this work-around!)
Thanks for visiting, and enjoy your stay! --Lincoln :)
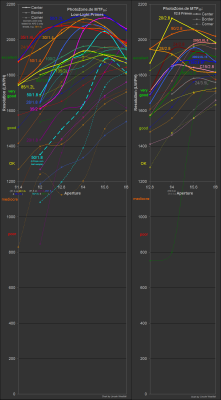 Primes Resolution |
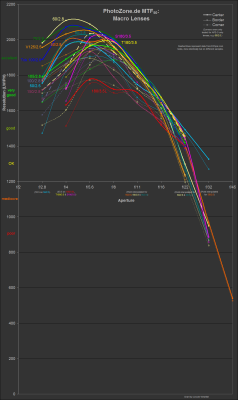 Macro Resolution |
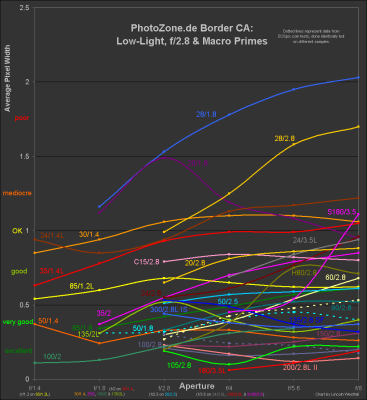 Primes CA |
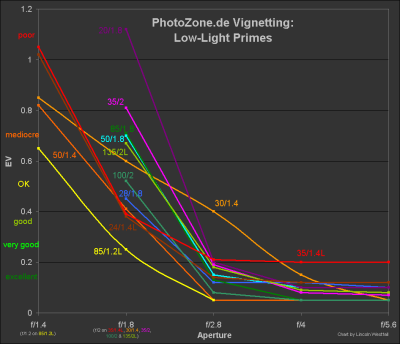 Low-Light Primes Vignetting |
 (Ultra-)Wide-Angle Resolution |
 (Ultra-)Wide-Angle CA |
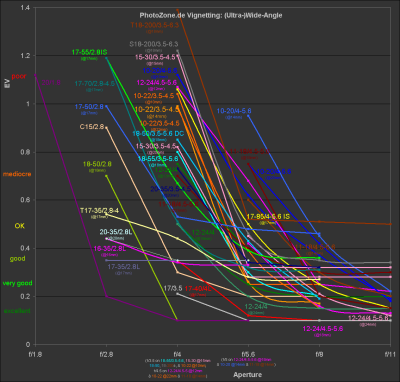 (Ultra-)Wide-Angle Vignetting |
 f/2.8 Zooms Resolution |
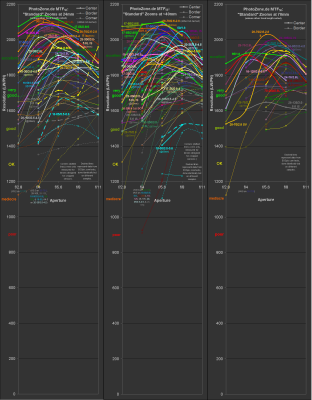 Standard Zooms Resolution |
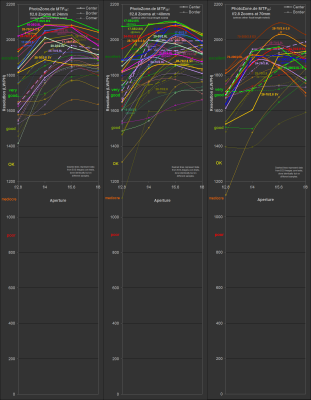
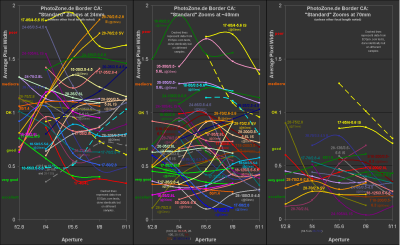
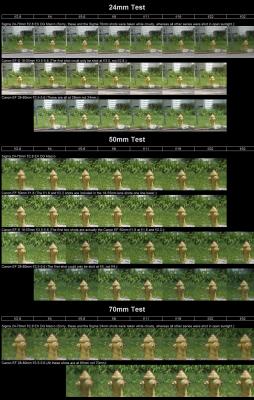
 Standard Zooms Resolution (@~24mm, big) |
 Standard Zooms Resolution (@~40mm, big) |
 Standard Zooms Resolution (@~70mm, big) |
 Standard Zooms CA |
 Telephotos Resolution |
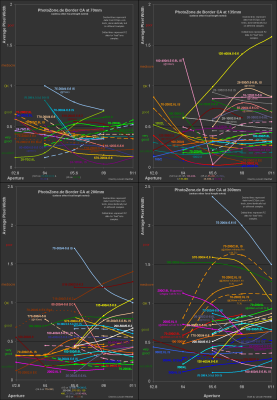 Telephotos CA |
 Super-Telephotos Resolution |
 Super-Telephotos CA |
 Select Lenses Combined Resolution |
 70-200s Resolution (with Sigma) |
 70-200s CA (with Sigma) |
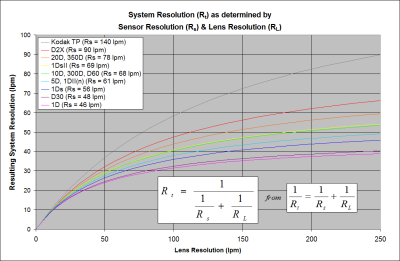 System Resolution based on Lens and Sensor Resolutions |
 fStopJojo's 24-70EX vs. My Original 24-70EX vs. 70-200/2.8L |
 My original 24-70/2.8EX fixed in Japan |
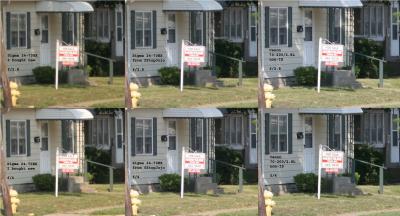
 Original 24-70/2.8EX vs. Cheap Lenses at 24mm, 50mm, 70mm |
 24-70EX AF Repaired |
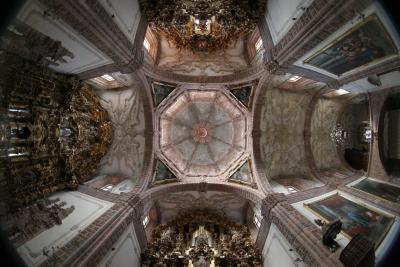
:: Peleng 8mm f/3.5 Fisheye :: |

:: Sigma 24-70mm f/2.8 EX DG Macro Samples :: |
| comment | share |
| lwestfall | 19-Nov-2008 06:31 | |
| Stan B | 10-Mar-2008 15:35 | |
| joe | 01-Nov-2006 06:47 | |