


|
|
|
|
|
|
| - | profile | all galleries >> Galleries >> bardarbunga | tree view | thumbnails | slideshow |
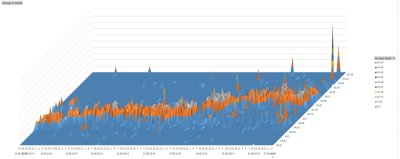
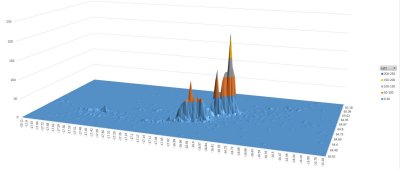
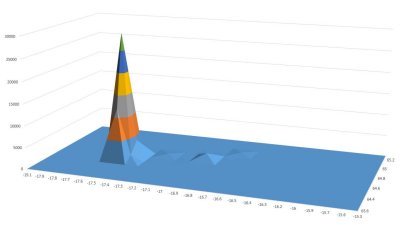 Bardarbunga 16Aug-27Aug Total energy released.JPG |
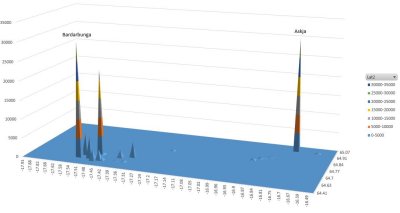
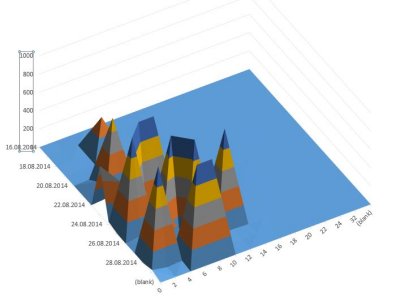
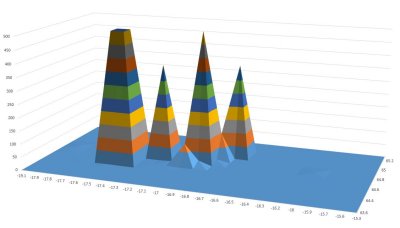 Bardarbunga 16Aug-27Aug Total energy released with 500GJ max.JPG |
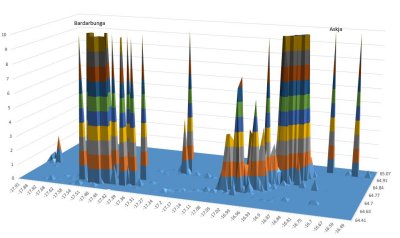
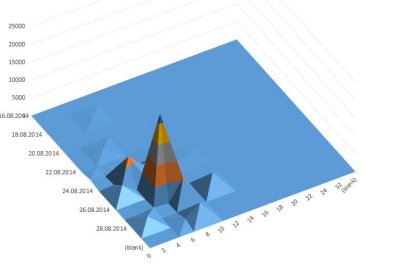
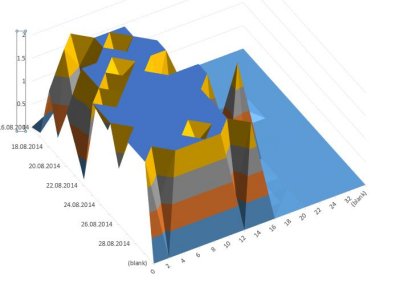
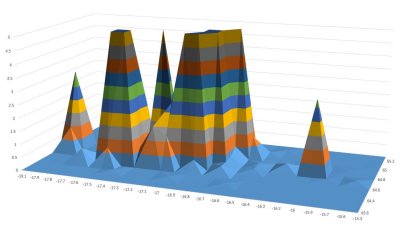 Bardarbunga 16Aug-27Aug Total energy released with 5GJ max.JPG |
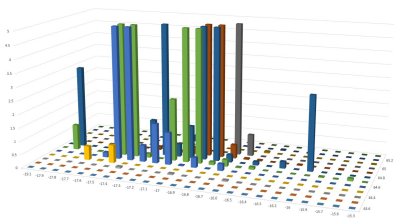
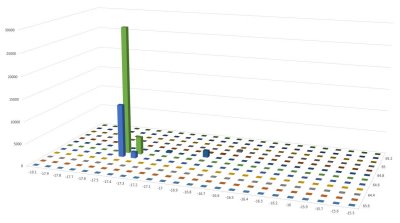 Bardarbunga 16Aug-27Aug Total energy released Bar chart.JPG |
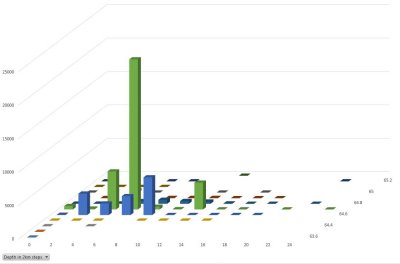
 Bardarbunga 16Aug-27Aug Total energy released with 5GJ max Bar chart.JPG |
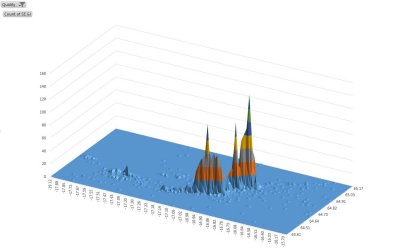
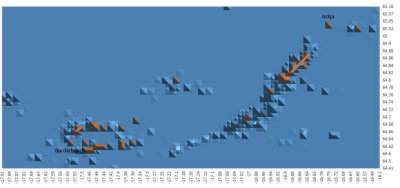
 Latitude and depth energy 16Aug-27Aug.JPG |
 Bardarbunga 16Aug-27Aug Number of EQ.JPG |
 Average depth over time.JPG |
 Average depth over time with Askja.JPG |
 Bardabunga total energy with volcanoes 16-28th 1.JPG |
 Bardabunga total energy with volcanoes 16-28th 2.JPG |
 Bardabunga total energy with volcanoes 16-28th 3.JPG |
 Bard.JPG |
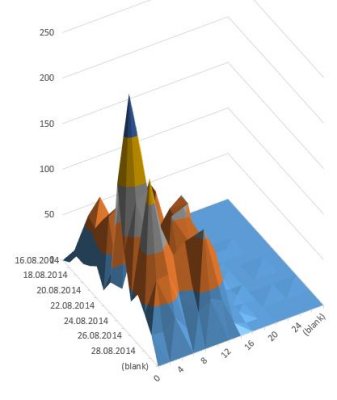
 29th total energy per location.JPG |
 29th total energy per location dyke detail.JPG |
 29th total energy per location dyke detail from top.JPG |
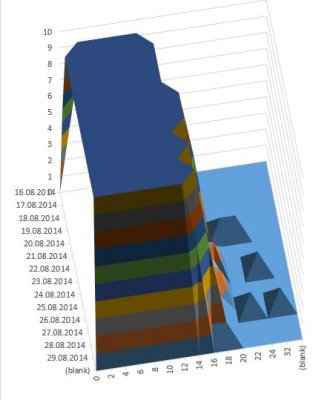
 29th amount of EQ per location.JPG |
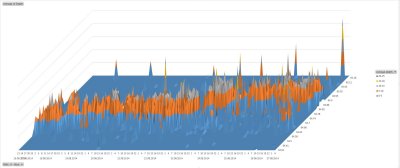
 Energy release per depth per day 2.JPG |
 Energy release per depth per day.JPG |
 Energy release per depth per day 3.JPG |
 count of EQ per depth per day.JPG |
 count of EQ per depth per day 2.JPG |
 Bardarbunga sept 1st.JPG |
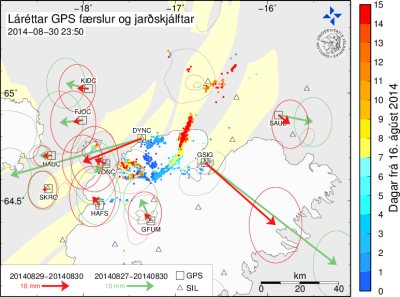 IMO movement.png |
| comment | share |