


|
|
|
|
|
|
| |
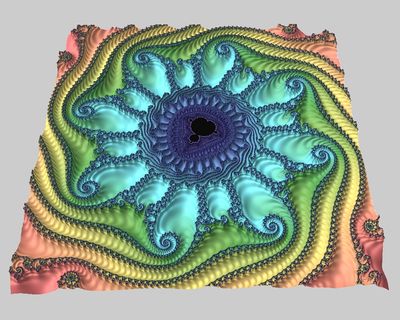
A Mandelbrot set image who's coordinates are drawn from an article by Paul Bourke titled "The Mandelbrot at a Glance".
Center Point (real, imaginary): -0.7746806106269, 0.13741688560379 i
Plot Width (real): 1.5E-12
Rendered as a 3D height map using Distance Estimate (DE) data to calculate height values.
For this version I also varied the height of each vertex in the image by applying a sine wave to the fractional iteration value of each point (With the sine function adjusted to apply a half wave for each integer iteration value.)
It uses histogram-based coloring, plus Distance Estimate (DE) data to darken the thin tendrils or "Dendrites" that connect Mandelbrot set points.
See this link for a 2D version of the image
Fractalworks plot paul bourke image
Copyright 2001-2023 Duncan Champney. May not be reproduced without written permission