https://covid.cdc.gov/covid-data-tracker/#wastewater-surveillance
SARS-CoV-2 RNA percent change calculations
The percent change in SARS-CoV-2 RNA levels is presented. Percent change is calculated as the modeled change over a 15-day interval, based on linear regression of log-transformed SARS-CoV-2 levels. Percent change for 15-day intervals containing fewer than 2 samples is listed as “No recent data” and is colored gray on the map. SARS-CoV-2 RNA levels are wastewater concentrations that have been normalized for wastewater composition. Normalization is based on wastewater flow rate and population for liquid wastewater samples, and by human fecal content measurements for sludge samples. See the NWSS Data Analytics page for more information.
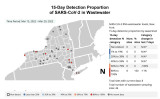
SARS-CoV-2 RNA detection proportion calculations
The detection proportion of SARS-CoV-2 RNA in wastewater is presented. The detection proportion is the percent calculated by dividing the 15-day rolling sum of SARS-CoV-2 detections by the 15-day rolling sum of the number of tests for each sewershed and multiplying by 100. Sewersheds with at least one test and no detections over the past 15 days are listed as “Non-detects” and are shown as hollow circles with a black outline on the map. Detection proportion for 15-day intervals containing no samples is listed as “No recent data” and is colored gray on the map.
SARS-CoV-2 RNA detection proportion categories
Non-detect is defined as no SARS-CoV-2 detections among all tests in the 15-day interval during which at least one test was performed.
Category change in last 7 days calculations
The category change in the last 7 days is a relative change. It is calculated by subtracting the current number of sites in each metric category from the number of sites in the same category 7 days earlier and dividing by the number of sites in the same category 7 days earlier.
*If a metric category had no sites in it 7 days earlier, the category change in last 7 days is listed as 'N/A*' since you cannot divide by 0.