


|
|
|
|
|
|
| |
| 22-JAN-2016 | |
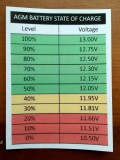
This image is an epic fail on my customers part. He found this voltage to SOC chart on the net and I found it on his chart table. He was using it with resting voltages not loaded voltages as this chart was likely developed from.
If we examine this chart to the 20 hour rate loaded voltages in my test here they line up pretty closely but if using a chart like this for a RESTING VOLTAGE you will be murdering your batteries.
___Chart V___Test V
90% 12.75V > 12.55V
80% 12.50V > 12.50V
70% 12.30V > 12.37V
60% 12.15V > 12.24V
50% 12.05V > 12.11V
Some charts on the net are for resting voltages and some of them are for 20 hour rate loaded voltages. If using voltage as an indicator of SOC the rate of discharge can affect your SOC to voltage points. Using the WRONG CHART only exacerbates this and makes your method of murdering your batteries even worse.
© All Images property of Compass Marine Inc.