


|
|
|
|
|
|
| |
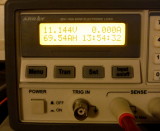
This is a shot of one of my capacity tester screens after testing the battery pictured above.
To compound the issues with these batteries the owner was using the -Ah’s or consumed energy screen in order to discharge the bank to his assumed 50% SOC. Unfortunately this is not the correct screen for tracking SOC.
Why?
The –Ah’s screen on many Ah counters does not compensate for Coulombic efficiency, temperature or Peukert. While older Link monitors placed a CEF calculation into -Ah's returned during charging it relied on the CEF actually being accurate from the last charge cycle for the successive charge cycles. In later models the CEF was removed from the -Ah's screen for "compensation" during charging and placed into the compensated SOC area of the meter.. Only the % charged or the SOC screens actually compensate for the factors listed. As you know by now these factors affect & adjust your actual SOC up or down from the actual Ah’s removed.
By using –Ah’s or consumed energy type screens only, you can wind up with a misrepresentation of your actual SOC. Discharging 50% of the assumed capacity from a 200Ah bank, in theory, leaves you with 100Ah’s. This owner only really has a 139 Ah bank so remove 100Ah’s from that bank, not even accounting for temp, Peukert etc., and we are really taking the bank to approx 28% SOC with each owner assumed dip to 50% SOC. What if he used the negative Ah's screen to discharge 50% of the assumed 200 Ah capacity and his batteries were just 45F and 139 Ah's? While a number of Ah counters have the option for a temp sensor, I can count on one hand the number of installed Ah counters I have seen with a temp sensor being used.
These factors affect & adjust your actual SOC in relation to the actual -Ah’s removed. He was at approximately 28% SOC with each assumed cycle to 50% SOC if we just assume face value for -Ah's..
With these images of actual tested capacity it becomes very easy to see how these batteries literally fell off the proverbial cliff in just three years. Was the battery monitor the sole cause of the demise of these batteries? No, absolutely not. Unfortunately as capacity faded, due to abuses, and the owner continued drawing them as if they were as new. The battery monitors incorrect programming and misuse began to contribute in a larger way to the demise and was actually hurting not helping. If the owner had done one simple thing, watched his "min bottom discharge voltage" of 12.2V he would have seen how out of sync his Ah counter was with the bank. In other words by using a low voltage limit, in addition to the consumed energy, you can catch these issues before they become a bigger problem.
If you want any sort of SOC based accuracy from an Ah counter you really should start with your banks actual measured & tested Ah capacity not an assumed capacity based on a sticker.
For al glimpse into how bad the situation really is I dug into my shop notes and invoices to show a few examples of ACTUAL vs. PROGRAMMED capacity. Below are a hand full of battery banks I have physically tested from boats with Ah counters installed. I have noted the both the banks actual tested capacity and the programmed capacity. FWIW all of these owners thought they knew how to use an Ah counter and many had no idea their batteries were as bad as they were..
Tested Battery Banks - Actual Capacity Vs. Programmed Capacity:
Deka G31 AGM 105Ah X 3 - #1=68.4Ah, #2=68.7Ah, #3=69.1Ah
ACTUAL = 206.2Ah
PROGRAMMED = 300Ah
Lifeline G27 AGM 100Ah X 4 – #1=71.4Ah, #2=71.0Ah, #3=70.9Ah, #4=71.2Ah
ACTUAL = 284.5Ah
PROGRAMMED = 400Ah
Trojan J185 FDC 205Ah X 4 - #1=154.3Ah, #2=151.2Ah #3=155.1Ah, #4=149.2Ah
ACTUAL = 609.6Ah
PROGRAMMED = 820Ah
Deka 8D GEL 225Ah X 2 - #1=216.1Ah, #2=215.8Ah
ACTUAL = 431.9Ah
PROGRAMMED = 450Ah
Full River G31 AGM 115Ah X 4 - #1=89.3Ah, #2=88.4Ah, #3=89.9Ah, #4=90.1Ah
ACTUAL = 277.7Ah
PROGRAMMED = 440Ah
Deka 4D AGM 198Ah X 3 - #1=63.4Ah, #2=69.6Ah, #3=73.8Ah
ACTUAL = 206.8Ah
PROGRAMMED = 590Ah
Firefly G31 AGM 110Ah X 3 - #1=110.1Ah, #2=109.7Ah, #3=110.4Ah
ACTUAL = 330.2Ah
PROGRAMMED = 330Ah
Odyssey G31 AGM 100Ah X 4 - #1=77.1Ah, #2=78.4Ah, #3=78.9Ah, #4=79.2Ah
ACTUAL = 313.6Ah
PROGRAMMED = 380Ah
*East Penn 6V GC-15 230Ah X 6 – Pair #1=112.3Ah
*ACTUAL = 336.9Ah
PROGRAMMED = 650Ah
**Trojan GC-12 FDC 150Ah X 5 - #1=62.8Ah, #2=66.9Ah, #3=54.6Ah
**ACTUAL = 307.1Ah
PROGRAMMED = 700Ah
*Only tested two of the six as a 12V series pair and data extrapolated for all six based on pair #1.
** Only tested three batteries, no sense going further, data averaged and extrapolated for actual capacity.
© All Images property of Compass Marine Inc.